B2B Sales Dashboard
This guide explains the B2B Sales Dashboard on the Home page — the metrics it shows, the date ranges you can pick, and the requirements to view it.
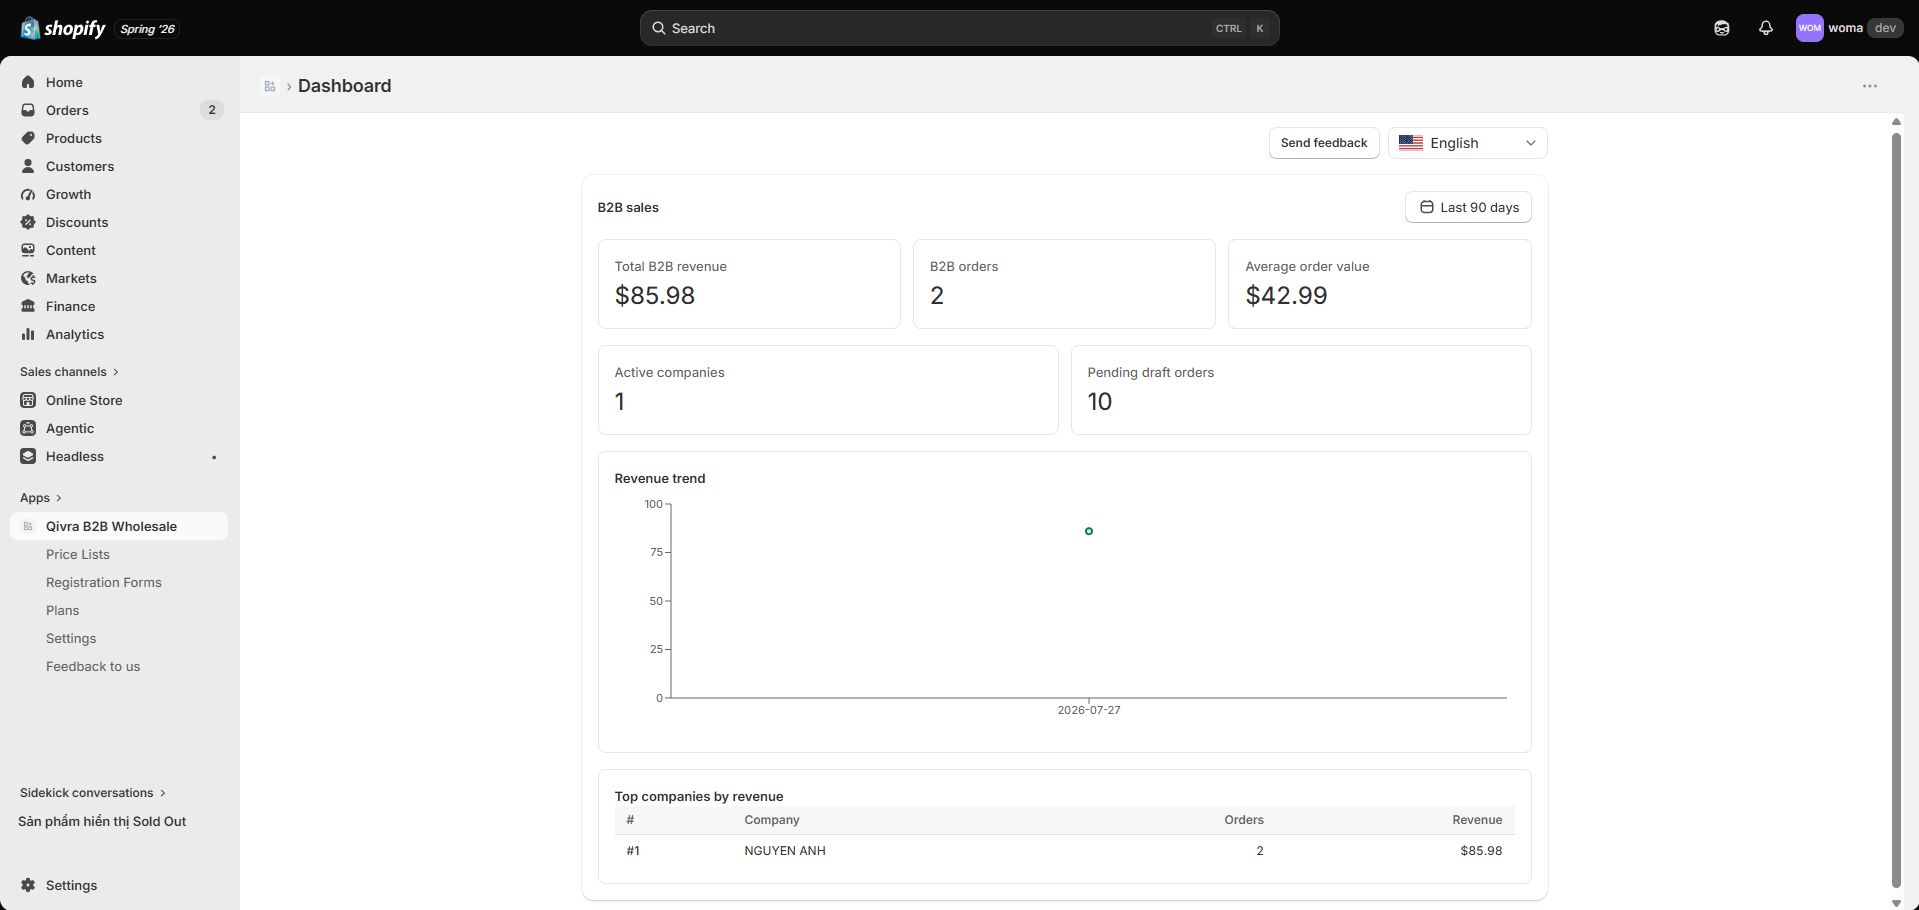
Where to find it
Section titled “Where to find it”The dashboard is on the app Home page, below the Setup Guide. It updates based on the selected date range.
KPI cards
Section titled “KPI cards”| Metric | What it means |
|---|---|
| GMV | Gross merchandise value of B2B orders in the range |
| B2B orders | Number of B2B orders in the range |
| AOV | Average order value across those orders |
| Active companies | B2B companies currently active on your store |
| Pending draft orders | Draft orders awaiting completion |
Revenue trend chart
Section titled “Revenue trend chart”The revenue trend chart shows how your B2B revenue moves over the selected range. Use it to spot spikes, dips, and seasonal patterns.
Top companies leaderboard
Section titled “Top companies leaderboard”The leaderboard ranks your B2B companies by revenue so you can see your most valuable accounts at a glance.
Date ranges
Section titled “Date ranges”Use the date range selector to choose a window:
- Today, Yesterday
- Last 7 / 30 / 90 / 365 days
- Last month, Last year
- Week to date, Month to date
- Custom range
The default range is last 90 days.
Requirements to view the dashboard
Section titled “Requirements to view the dashboard”The dashboard pulls order data through Shopify’s reporting APIs. Two conditions must be met:
read_reportsscope granted — if the app is still waiting for this scope, the dashboard shows a scopes pending state. Re-authorize the app from Shopify to grant it.- Shopify Plus store — B2B company/order reporting requires Shopify Plus. Non-Plus stores see a Shopify Plus required notice.
If the dashboard shows empty, there is simply no B2B order data in the selected range yet.
Note on order identification: the dashboard identifies B2B orders using Shopify’s B2B channel signals and customer tags. During early rollout, counts may include all orders in range until the storefront B2B-cart-attribute wiring is fully complete. Use the trend rather than absolute totals as the source of truth until then.